top of page
GU INSTITUTE OF EARTHQUAKE
PREDICTION
Log In
Lastest earthquakes
Home
About
Bio
Initiative
Administration
Scientists
Counselors
Prof Jicheng Gu
Jobs
Science
Dashboard
Projects
Wiki-Prediction
Predictions
Groups
Forum
Media
Press Conference (2025-10-11)
Kid's Channel
Donate
Contact
Use tab to navigate through the menu items.
V
IDE
O
S
Share
Whole Channel
This Video
Facebook
Twitter
Pinterest
Tumblr
Copy Link
Link Copied
Earthquake Channel
All Categories
Play Video
Play Video
02:30
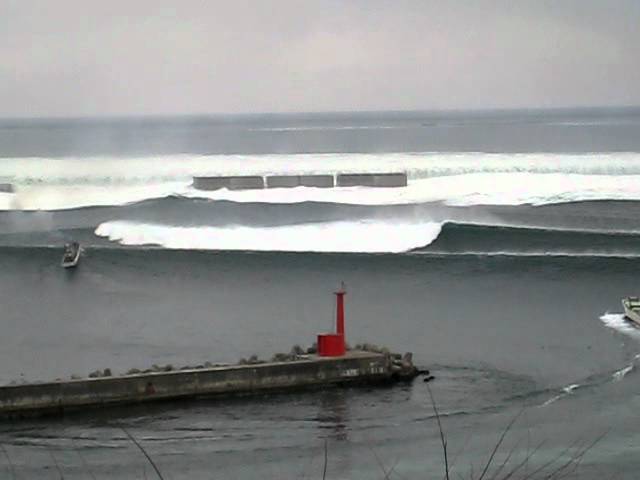
Japan Tsunami 3-11-2011
The video was taken at Kuji Port in the Iwate Prefecture and was provided by the Kamaishi Port Office, Ministry of Land, Infrastructure, Transport and Tourism (MLIT).
Play Video
Play Video
01:27
GU Earthquake Remarks by Breanna Lungo Koehn, Major of Medford
GU Institute of Earthquake Preiction (GUIEP) is a Non-Profit Sciense Organization focusing on earthquake prediction. We invite you join us to save more lives and protect properties. GUIEP (www.guiep.org)
Play Video
Play Video
06:54
The biggest Earthquake (M 9.5, Chile 1960) ever recorded by human being
The biggest Earthquake (M 9.5, Chile 1960) ever recorded by human being
Play Video
Play Video
01:50
Tsunami Forecast Model Animation: Chile 1960
On May 22, 1960, at 3:11 pm (19:11 UTC) the largest earthquake ever recorded by instruments struck southern Chile with a magnitude we now know to be at least 9.5. This earthquake generated a tsunami that traveled through every ocean on earth, though large, dangerous waves only impacted the coastlines around the Pacific Ocean. Chile suffered the greatest impact, with tsunami waves reaching as high as 25 m or 82 ft., killing an estimated 2000 people there. Outside of Chile the tsunami was worst on the opposite side of the planet in Japan, where waves reached as high as 6.3 m or over 20 ft and killed 139 people. In between and halfway across the Pacific Ocean Hawaii suffered the second-worst tsunami in its recorded history--only the Aleutian Islands tsunami of 1946 was worse. It killed 61 people in the town of Hilo with waves reaching as high as 10.7 m or about 35 ft. and all Hawaiian Islands experienced waves well over 1 m or 3 ft. The Philippines also lost 21 people to waves recorded as high as 1.5 m or nearly 5 ft, and two more people died in California from waves reaching 2.2 m or over 7 ft. high. Elsewhere around the Pacific Ocean tsunami waves reached as high as 12.2 m or 40 ft at Pitcairn Island (U.K), 7.0 m or 23 ft. in Russia (Kamchatka), 5.0 m or over 16 ft. in New Zealand, 4.9 m or 16 ft. in (Western) Samoa, 2.4 m or about 8 ft. in French Polynesia, 2.1 m or 7 ft. in Canada, 1.8 m or about 6 ft. in Papua New Guinea, and 1.2 m or about 4 ft. in Mexico. In the United States and it territories 2.4 m or about 8 ft. in American Samoa, 2.3 m or 7.5 ft. in Alaska, and 1.8 m or about 6 ft. in Oregon. A global tsunami warning system did not exist in 1960 and the Honolulu Magnetic and Seismic Observatory, which would later become the Pacific Tsunami Warning Center (PTWC), did issue tsunami warnings for this earthquake to the State of Hawaii many hours in advance of its arrival (it would take almost 15 hours for the first wave to reach Hawaii). As a result of this tsunami the United Nations would set up the Pacific Tsunami Warning System (PTWS) in 1965 with the Honolulu Observatory as its headquarters. Today, more than 50 years since the Great Chile Earthquake and the establishment of the PTWS, the PTWC will issue tsunami warnings in minutes, not hours, after a major earthquake occurs, and will forecast how large any resulting tsunami will be as it is still crossing the ocean. The PTWC can also create an animation of a historical tsunami with the same tool that it uses to determine tsunami hazards in real time for any tsunami today: the Real-Time Forecasting of Tsunamis (RIFT) forecast model. The RIFT model takes earthquake information as input and calculates how the waves move through the world’s oceans, predicting their speed, wavelength, and amplitude. This animation shows these values through the simulated motion of the waves and as they travel through the world’s oceans one can also see the distance between successive wave crests (wavelength) as well as their height (half-amplitude) indicated by their color. More importantly, the model also shows what happens when these tsunami waves strike land, the very information that the PTWC needs to issue tsunami hazard guidance for impacted coastlines. From the beginning the animation shows all coastlines covered by colored points. These are initially a blue color like the undisturbed ocean to indicate normal sea level, but as the tsunami waves reach them they will change color to represent the height of the waves coming ashore, and often these values are higher than they were in the deeper waters offshore. The color scheme is based on the PTWC’s warning criteria, with blue-to-green representing no hazard (less than 30 cm or ~1 ft.), yellow-to-orange indicating low hazard with a stay-off-the-beach recommendation (30 to 100 cm or ~1 to 3 ft.), light red-to-bright red indicating significant hazard requiring evacuation (1 to 3 m or ~3 to 10 ft.), and dark red indicating a severe hazard possibly requiring a second-tier evacuation (greater than 3 m or ~10 ft.). Toward the end of this simulated 36 hours of activity the wave animation will transition to the “energy map” of a mathematical surface representing the maximum rise in sea-level on the open ocean caused by the tsunami, a pattern that indicates that the kinetic energy of the tsunami was not distributed evenly across the oceans but instead forms a highly directional “beam” such that the tsunami was far more severe in the middle of the “beam” of energy than on its sides. This pattern also generally correlates to the coastal impacts; note how those coastlines directly in the “beam” are hit by larger waves than those to either side of it. ---------- Earthquake source used: Fujii, Y. and K. Satake, Slip Distribution and Seismic Moment of the 2010 and 1960 Chilean Earthquakes Inferred from Tsunami Waveforms and Coastal Geodetic Data, Pure and Applied Geophysics, 170, 1493-1509, 2012
Play Video
Play Video
14:42
What Happens If Yellowstone Blows Up Tomorrow?
Watch this video ad-free on Nebula: https://nebula.tv/videos/real-life-lore-what-happens-if-yellowstone-blows-up-tomorrow Please Subscribe: https://www.youtube.com/channel/UCP5tjEmvPItGyLhmjdwP7Ww Select video clips courtesy of Getty Images
Play Video
Play Video
48:16
【台灣NEXT 全集】近期地震頻傳!專家預警 大震可能來襲!|葉雲炫 潘郁文 楊尚仁 房業涵 李樺仙 20220219
00:14 獨家! 米崙斷層蠢動 馬國鳳團隊 深入地底探秘! 09:05 台北山腳未爆彈! 斷層貫穿北台灣 雙北警戒! 18:05 獨家! 大樓型住宅 盆地共振效應 災損加劇! 26:05 直擊土壤液化天坑! 房市熱 買家忽略的地質秘密! 35:34 深入絕美地景! 神祕火山群 暗藏核廢料危機! 近期地震頻傳,震央多位在東部海域,專家推估,大規模地震可能來襲,我們準備好了嗎?全台高房價,中古屋交易熱絡,殊不知30年以上老舊建物的耐震係數不足,更有大量建築,位在高潛勢土壤液化區。面對可能的大震來襲,我們該提前做甚麼,政府又應有那些作為,才能保障人民身家安全? 訂閱【東森新聞】現在就加入》https://pse.is/396256 加入【東森新聞】會員,獨家影片搶先看》https://pse.is/39m9l8 #台灣NEXT #房業涵 #地震 #震央 #大規模地震 #老舊建物 #耐震係數 #中古屋 #土壤液化 #大地震 #米崙斷層 #盆地 #房市 #火山 #核廢料
Play Video
Play Video
10:11
Aftermath of the Biggest Volcano Eruption Ever Caught on Tape from Space - Tonga
The live aftermath of the Hunga Tonga-Hunga Ha'apai Jan 15 2022 volcano eruption. Claim your SPECIAL OFFER for MagellanTV here: https://try.magellantv.com/astrum. Start your free trial TODAY so you can watch "Guatemala: Volcanoes on Mayan Territory", and the rest of MagellanTV's science collection: https://www.magellantv.com/video/guatemala-volcanoes-on-mayan-territory Astrum merch now available! Apparel: https://teespring.com/stores/astrum-space Metal Posters: https://displate.com/promo/astrum?art=5f04759ac338b SUBSCRIBE for more videos about our other planets. Subscribe! http://goo.gl/WX4iMN Facebook! http://goo.gl/uaOlWW Twitter! http://goo.gl/VCfejs Astrum Spanish: https://bit.ly/2KmkssR Astrum Portuguese: https://www.youtube.com/channel/UChn_-OwvV63mr1yeUGvH-BQ Donate! Patreon: http://goo.gl/GGA5xT Ethereum Wallet: 0x5F8cf793962ae8Df4Cba017E7A6159a104744038 Become a Patron today and support my channel! Donate link above. I can't do it without you. Thanks to those who have supported so far! #tonga #volcano #HungaTongaHungaHaapai Image Credits: NASA/JAXA/NOAA/Kingdom of Tonga Music Credit: Lars Leonhard - Thunderbolt http://larsleonhard.bandcamp.com/track/thunderbolt
Play Video
Play Video
05:26
智利9.5级超级地震|又稱為瓦爾迪維亞大地震,發生在當地時間1960年5月22日下午3點11分。是人類史上觀測記錄到規模最大的地震|#iLife小品生活 #地震
震央靠近在智利,位於在聖地牙哥以南700公里附近,而且在瓦爾迪維亞也是遭到影響最嚴重的城市,掀起浪高高度是25公尺的巨大海嘯。並且也波及到遙遠的日本和菲律賓。
Play Video
Play Video
50:00
The Deadliest Tsunamis Of All Time | Mega Disaster | Earth Stories
Tsunamis are the oceans deadliest forces, bringing giant waves with immense and unstoppable power. No coastline on the planet is truly safe from these massive displacements of water, caused by two tectonic plates shifting under the ocean floor. In this episode of Mega Disaster, we travel the globe and learn about some of history’s worst tsunamis. Subscribe to Earth Stories to watch more documentaries: http://bit.ly/3iUO7th Earth’s tectonic forces can rip apart the land, homes and people’s lives. This series exposes their killer characteristics and why they can be so devastating. Any queries, please contact us at: owned-enquiries@littledotstudios.com #EarthStories #naturaldisaster #tsunami
Load More
P
HOTO
G
RAPHS
bottom of page